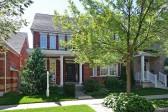
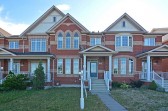
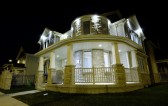
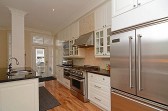
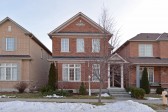
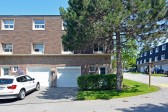
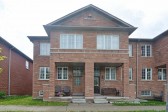
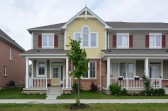
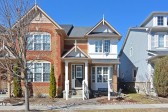
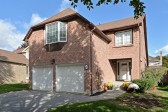
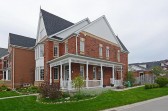
Here you will find the Woodland Hill Real Estate Sold Statistics for February 2015. As always, no averages are given to present an accurate depiction of the state of the market. For best results, if available, find a home that closely matches the area, square footage, and number of bedrooms to get a better depiction of what your home could be worth. If you require any further information please don’t hesitate to ask!
|
Type |
Bedrooms |
Bathrooms |
Square Footage |
Basement |
Garage Spaces |
Days on Market |
Sold Price |
Notes |
|
Townhome |
3 |
1.5 |
N/A |
Unfinished |
1 |
7 |
425,000 |
|
|
Townhome |
3 |
2.5 |
1781 |
Unfinished |
1 |
1 |
465,888 |
Walkout Basement |
|
Townhome |
3 |
2.5 |
1900 |
Finished |
1 |
13 |
494,500 |
|
|
3 |
2.5 |
1710 |
Unfinished |
1 |
7 |
496,000 |
End-Unit |
|
|
Semi |
4 |
2.5 |
1800 |
Unfinished |
1 |
17 |
489,000 |
|
|
Semi |
3 |
2.5 |
1887 |
Unfinished |
1 |
2 |
550,000 |
|
|
Detached |
3 |
2.5 |
1500-2000 |
Unfinished |
2 |
79 |
505,000 |
|
|
Detached |
3 |
2.5 |
1777 |
Unfinished |
1 |
2 |
570,000 |
|
|
Detached |
3+1 |
3.5 |
2000+ |
Finished |
2 |
1 |
600,000 |
Basement Apartment |
|
Detached |
4+1 |
2.5 |
N/A |
Unfinished |
2 |
4 |
588,000 |
|
|
Detached |
4 |
2.5 |
2000-2500 |
Unfinished |
1 |
27 |
583,999 |
|
|
Detached |
4+1 |
3.5 |
2000-2500 |
Finished |
2 |
8 |
635,000 |
Separate Basement Entrance |
|
Detached |
4 |
2.5 |
2000 – 2500 |
Finished |
1 |
17 |
600,000 |
|
|
Detached |
3+1 |
3.5 |
2000-2500 |
Finished |
1.5 |
10 |
661,000 |
|
|
Detached |
4 |
3.5 |
N/A |
Unfinished |
2 |
9 |
700,000 |
Separate Basement Entrance |
|
Detached |
4+2 |
4 |
2500-3000 |
Finished |
2 |
1 |
728,000 |
Walk-out, 2 .5 baths |
|
Detached |
4 |
4 |
2000-2500 |
Finished |
2 |
3 |
720,000 |
2 0.5 baths |
|
Detached |
4 |
3.5 |
2500-3000 |
Unfinished |
2 |
17 |
720,000 |
Walkout Basement |
|
Detached |
4+1 |
3.5 |
N/A |
Apartment |
2 |
2 |
745,000 |
Basement Apartment |
|
Detached |
5 |
3.5 |
3000 – 3500 |
Unfinished |
2 |
8 |
820,000 |
Brand New |
|
Detached |
4+1 |
3.5 |
N/A |
Finished |
2 |
14 |
815,000 |
Backs onto Conservation |


